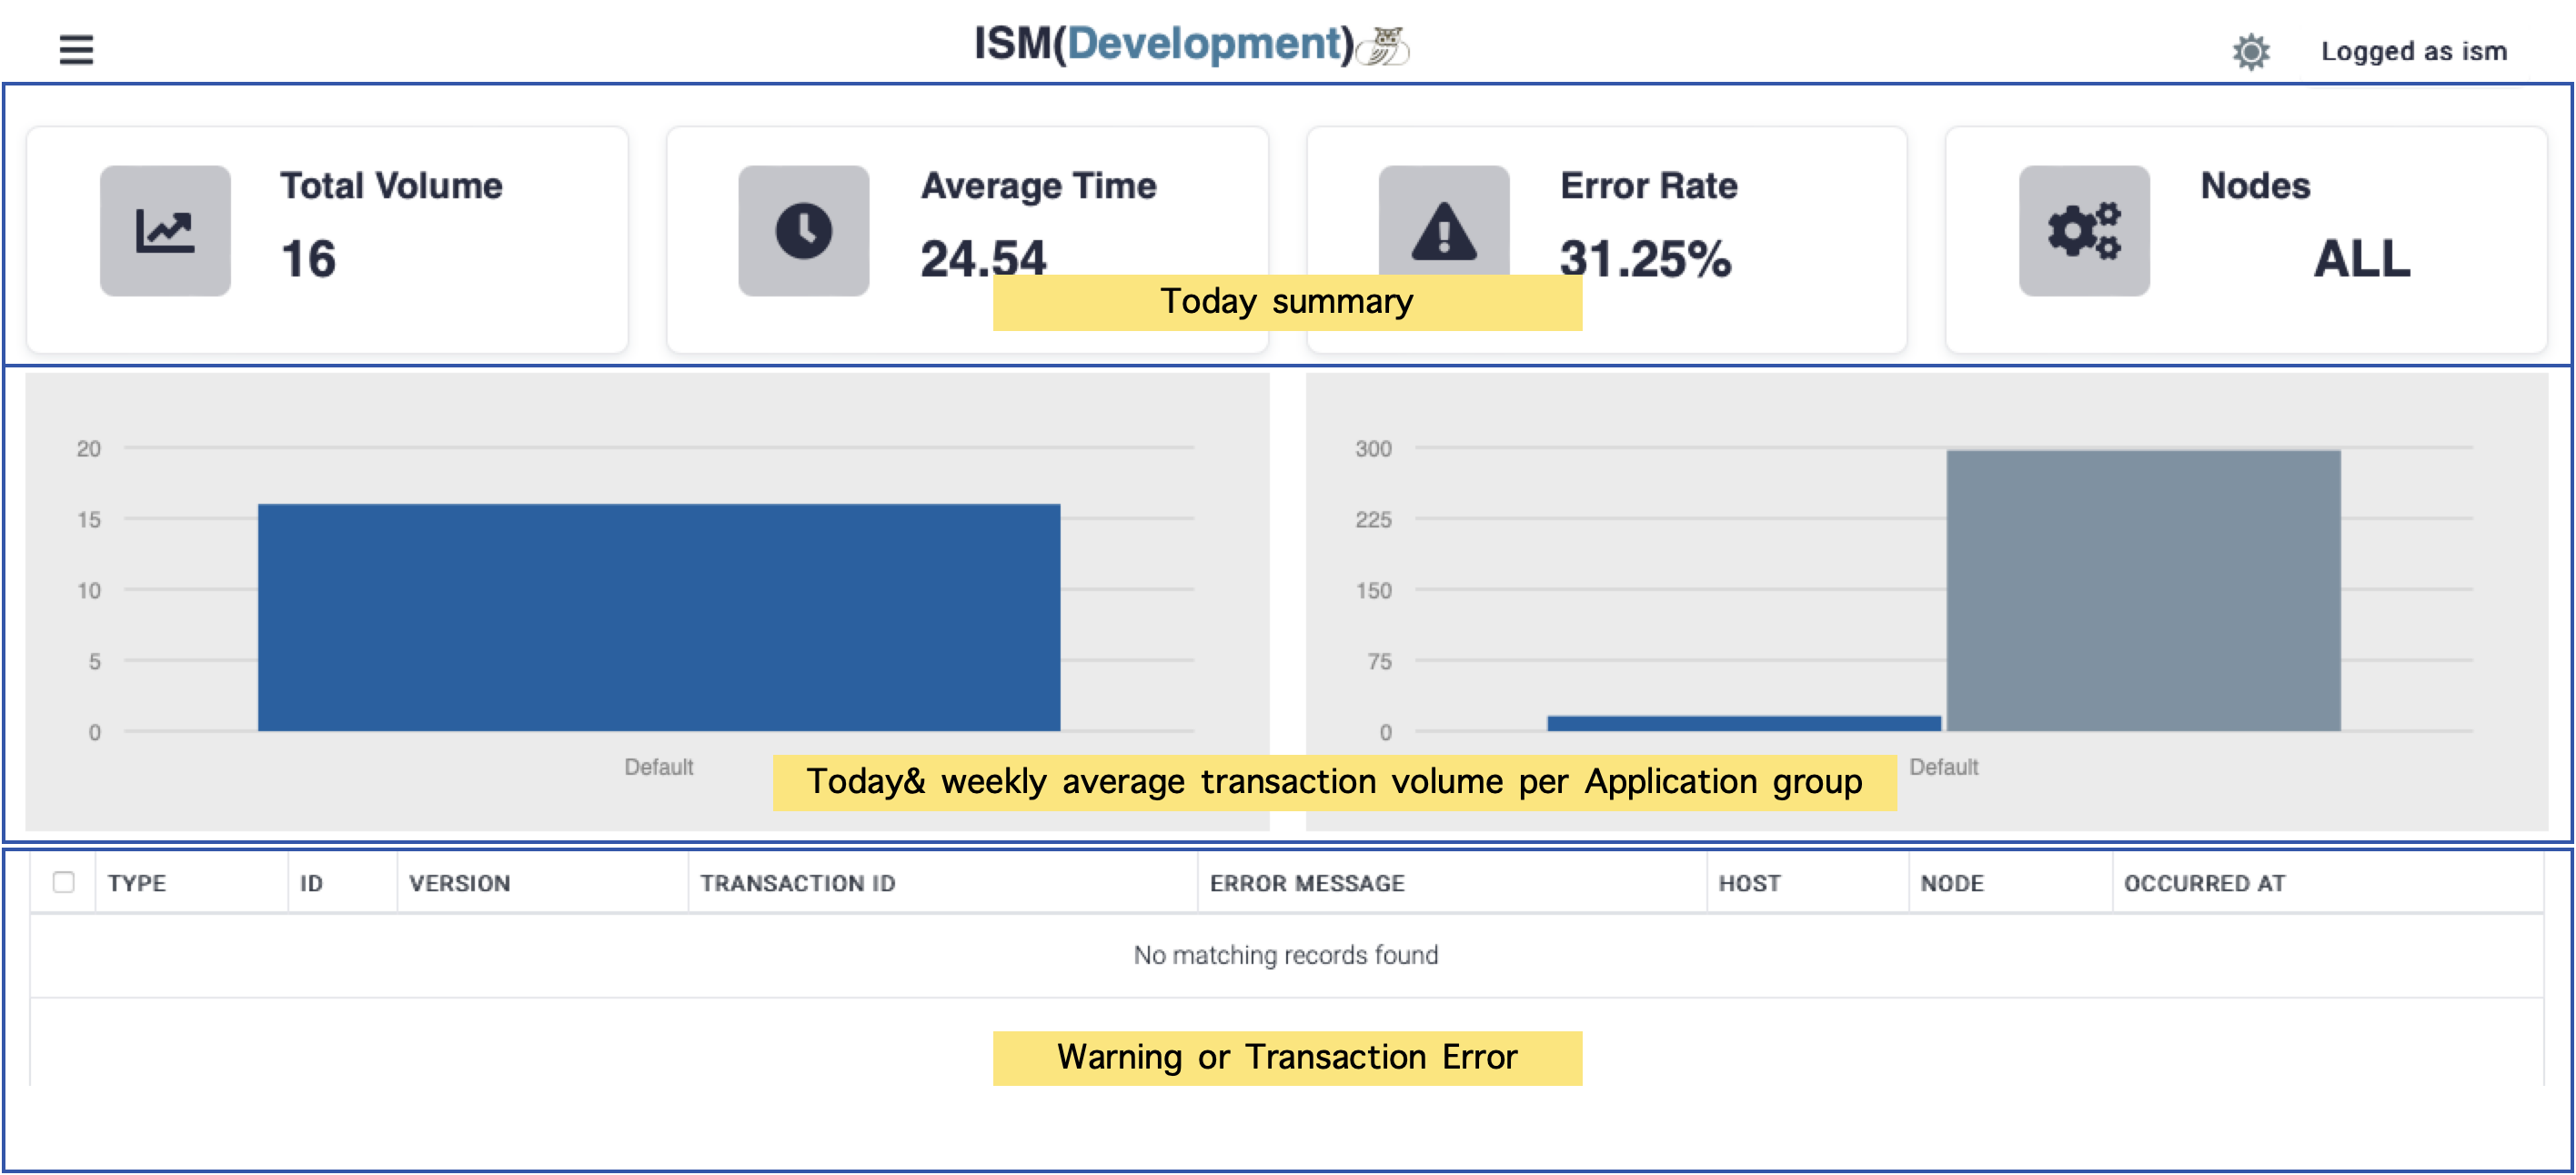
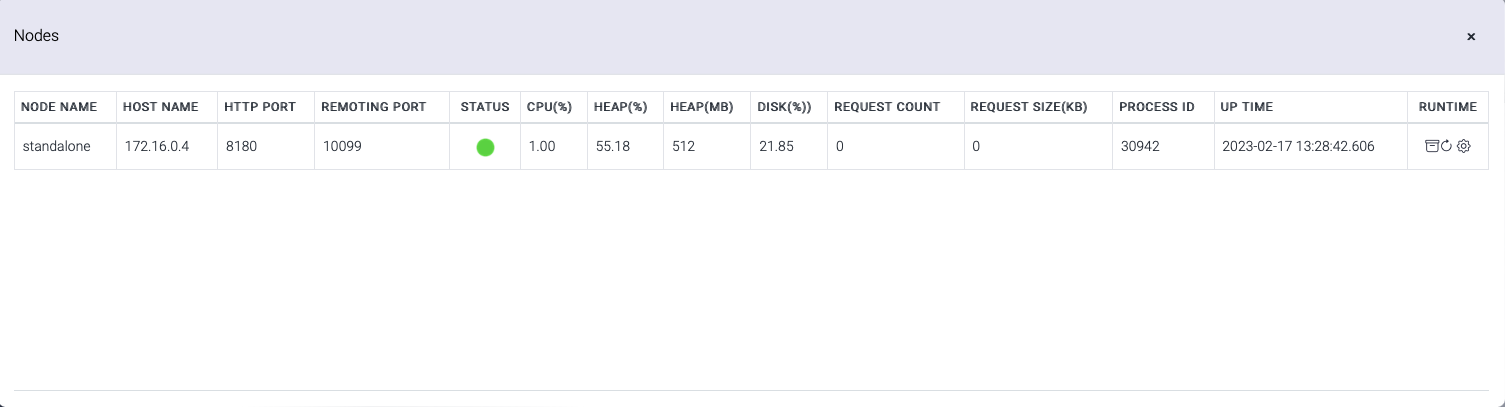
| Name | Description |
| Node Name | Instance name |
| Host Name | Host name of the instance |
| HTTP Port | Service port for the transactions |
| Remoting Port | Administrative port for the admin operations |
| Status | Instance status
|
| CPU(%) | CPU usage of this instance (%) |
| HEAP(%) | Heap memory usage (%) |
| HEAP(MB) | Maximum heap memory size (MB) |
| DISK(%) | Disk usage of this instance (%) |
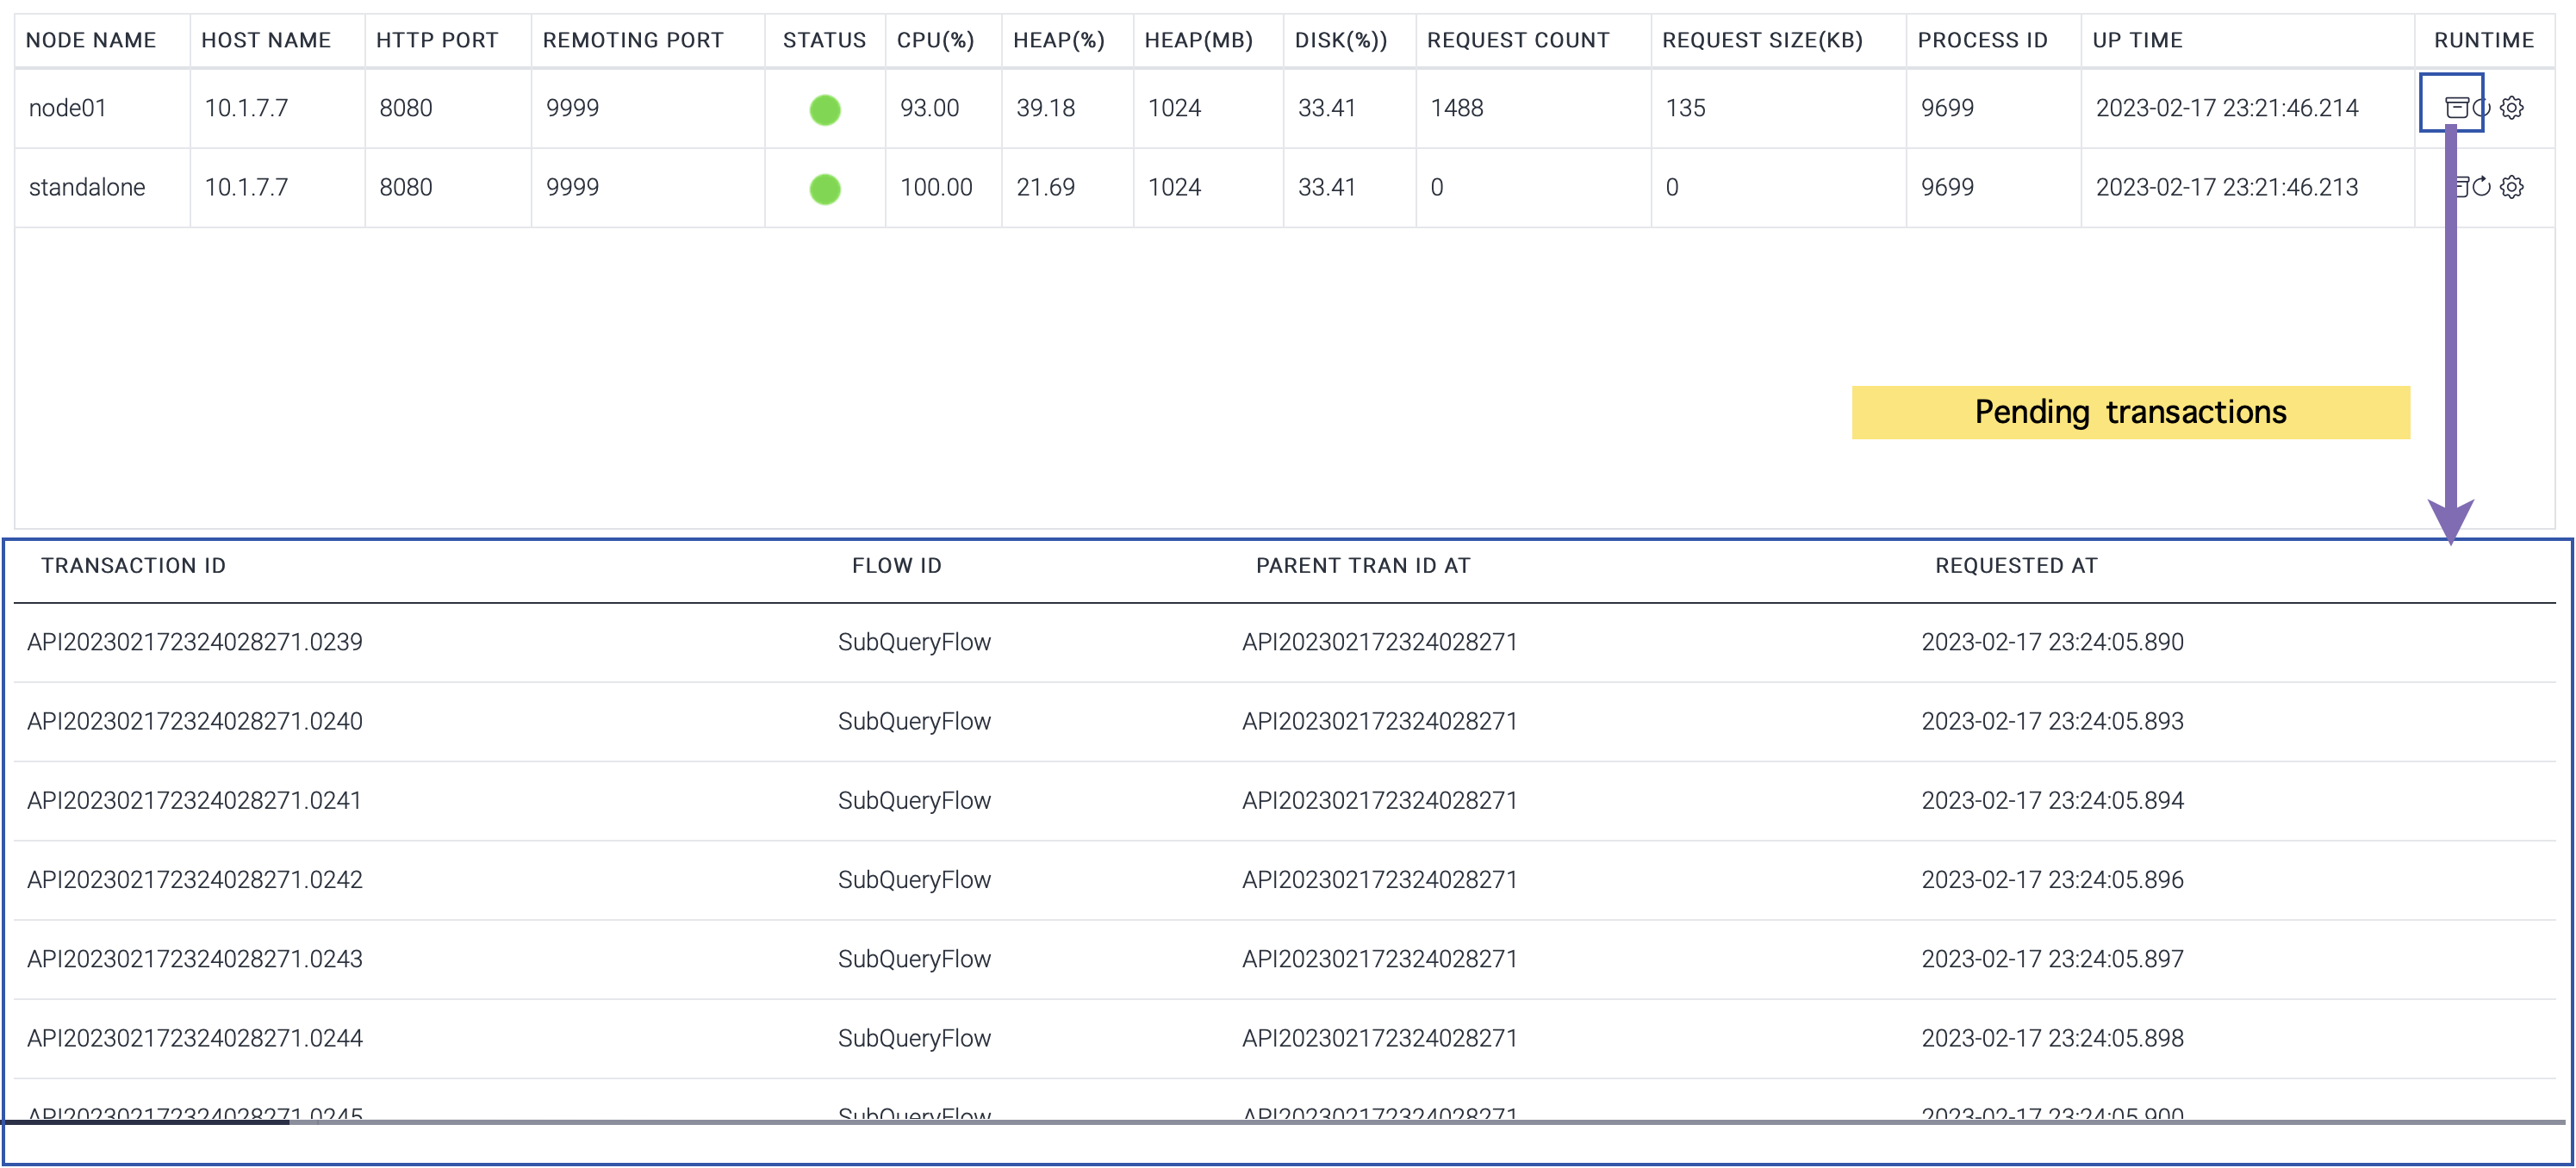
| Request Count | Pending request count for sub flow |
| Request Size(KB) | Data size of pending requests for sub flow(KB) |
| Process ID | Process id of this instance |
| Up Time | Up time of this instance. This time means the uptime of JVM. |
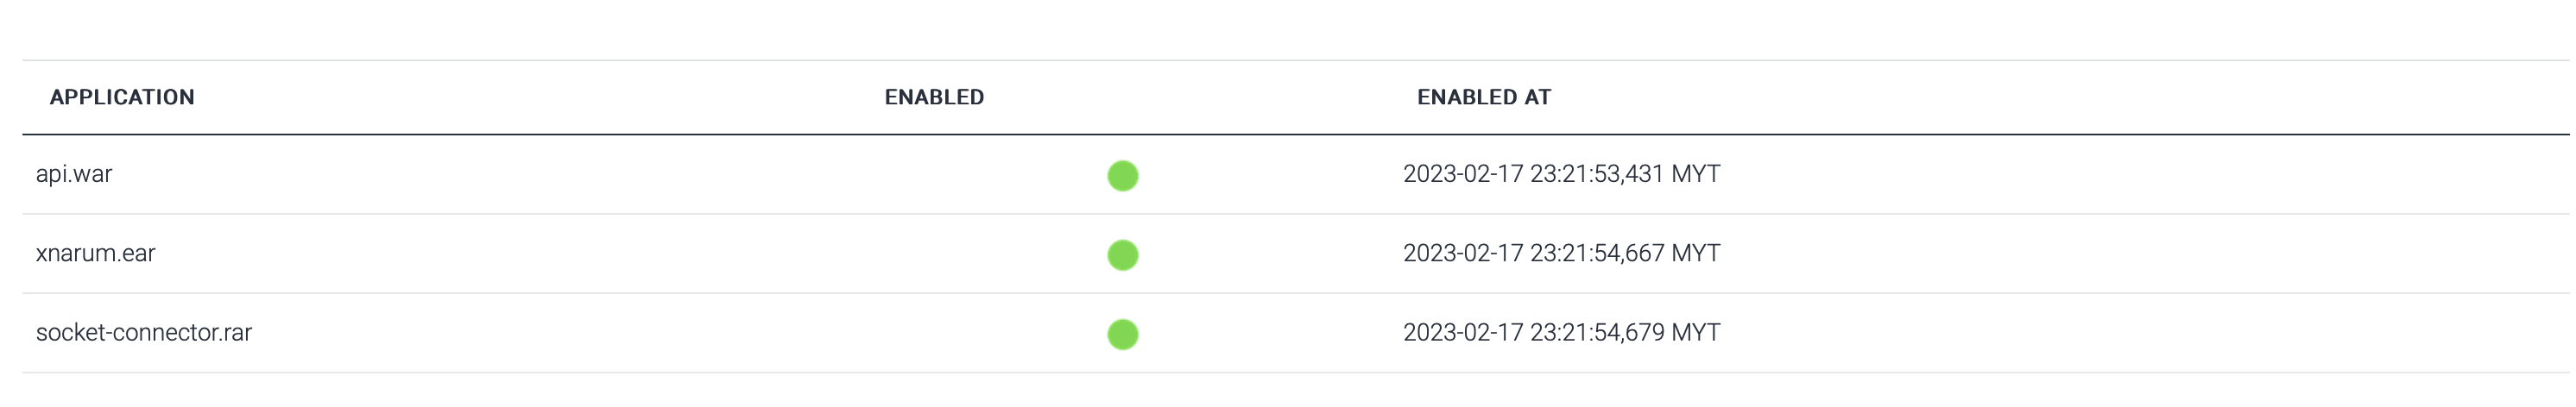
| Runtime | This column has 3 action links.
|
 up and running.
 down
down